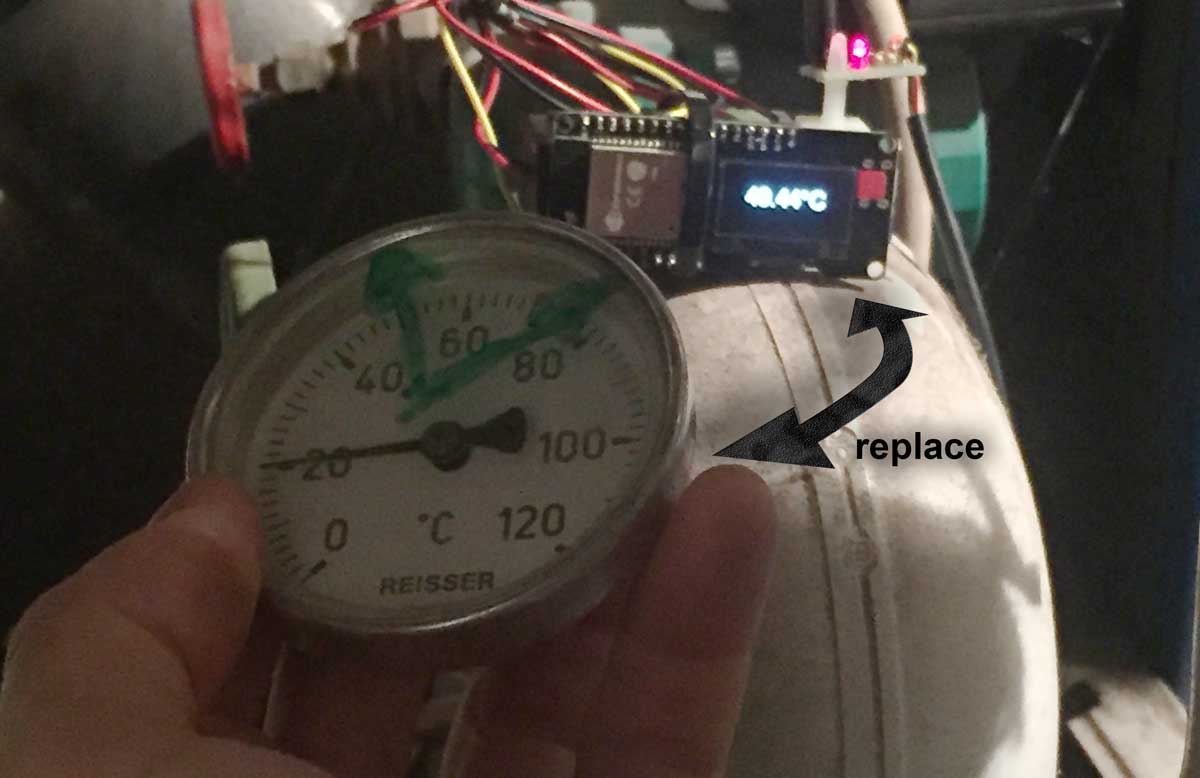
This project is the result of a simple everyday problem. My parents' house is still heated with wood in winter. That means there is a central heating of the year 1987 (Buderus Junomat S305) in the basement. The heating can be operated with wood and oil. However, in order to save as much oil as possible the heating usually runs on wood. This has the disadvantage that you always have to pay attention to when you need to add wood again. Besides, you should not have too much embers as the water in the connected water tank will become too hot. The temperature of the water tank is decisive for the temperature of the connected heaters in the house and the water temperature during showering. No fire in the basement - no hot shower! The only way to control the temperature is by an analog temperature display attached to the inlet pipe from the heating chamber to the boiler. Therefore you have to go to the basement every time, just to find out if the fire is still burning.
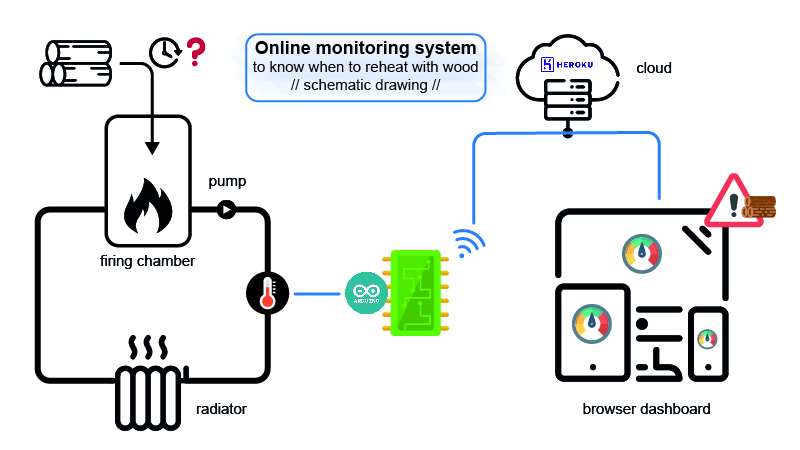
The data is measured by the thermometer on the Arduino and displayed every second on the OLED display attached to the device. This means that the temperature can still be read off the heating. Every minute the Arduino sends an HTTP POST request via the integrated Wifi module with the current temperature, the current time as timestamp and the battery status of the connected power supply. The device was originally designed so that it can only be operated with batteries and can therefore be used more flexibly. This data is sent to the RESTfull API of the NodeJS application. This is hosted on a Heroku server. A browser client application uses this API to query the data and display it in a dashboard. This allows the temperature data to be displayed and visualised using a time axis. The aim is to be able to predict when the fire will go out and give an indication in time by recording the data over a long period of time.
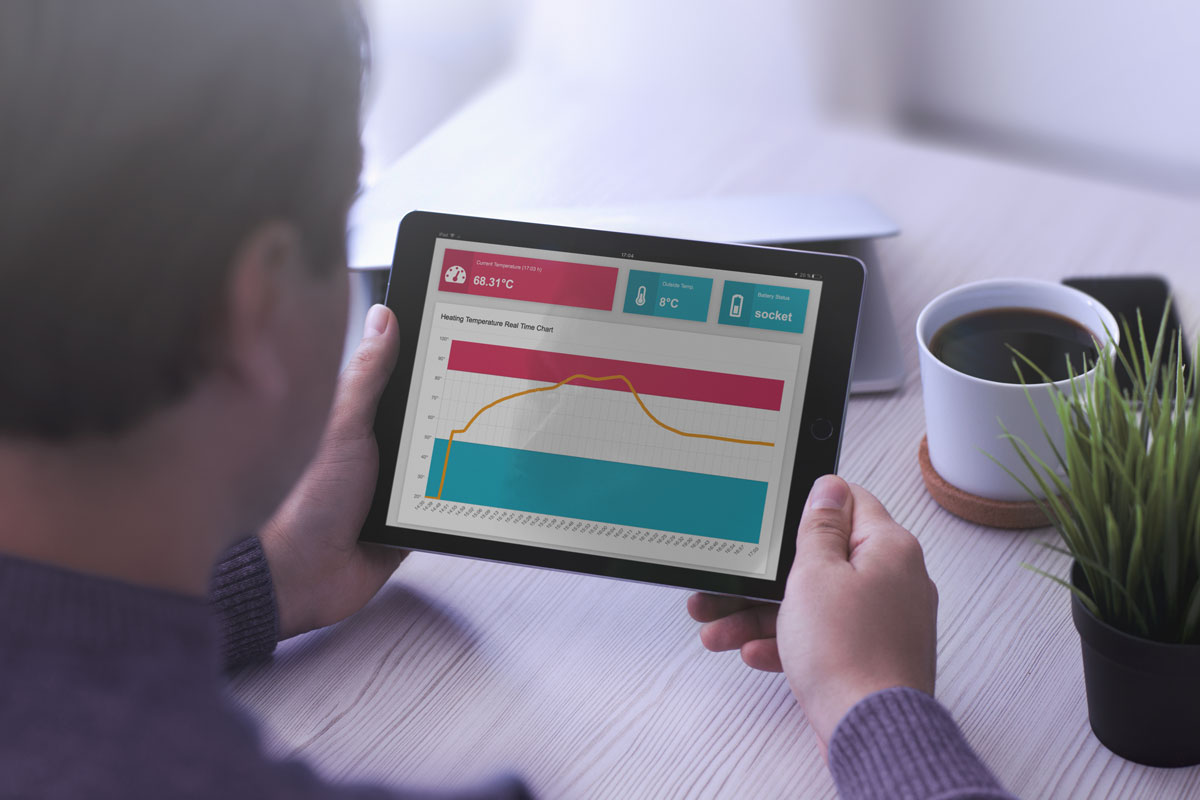
To ensure a good quality of living, the temperature must be constant between 50°C and 85°C. If it is too cold, the apartment cannot be sufficiently heated and the water in the shower becomes too cold. If it is too hot, the water in the connected water tank starts boiling from 100°C. Then an automatic valve will drain the water. The graph shows whether the temperature is approaching one of these limits and you can intervene accordingly.
Technical documentation
Technical documentation will follow
Dashboard
The following section displays the current live dashboard in an iframe. So you can see if my parents have been busy throwing in wood, or if they're freezing :)